
|
As you may know, my info graphic was about how stress affects the human body, and how it can be measured. I have been planning to plan my experiment around simple things like heart rate, blood pressure and so on. I could also use the sensor tag to measure the temperature of my subjects. I would probably use a scatter plot for both the resting and accelerated heart rate graphs, as everyone's body is slightly different than everyone else. Y-Access would be beats per minute, X would be the subject being tested. I would probably be testing a few different variables, for instance, how the body responds to jump scares compared to how it responds to phobias or long term fears like listening to creaking noises and footsteps in the dark. I'm still working everything out so I don't know what else to say... 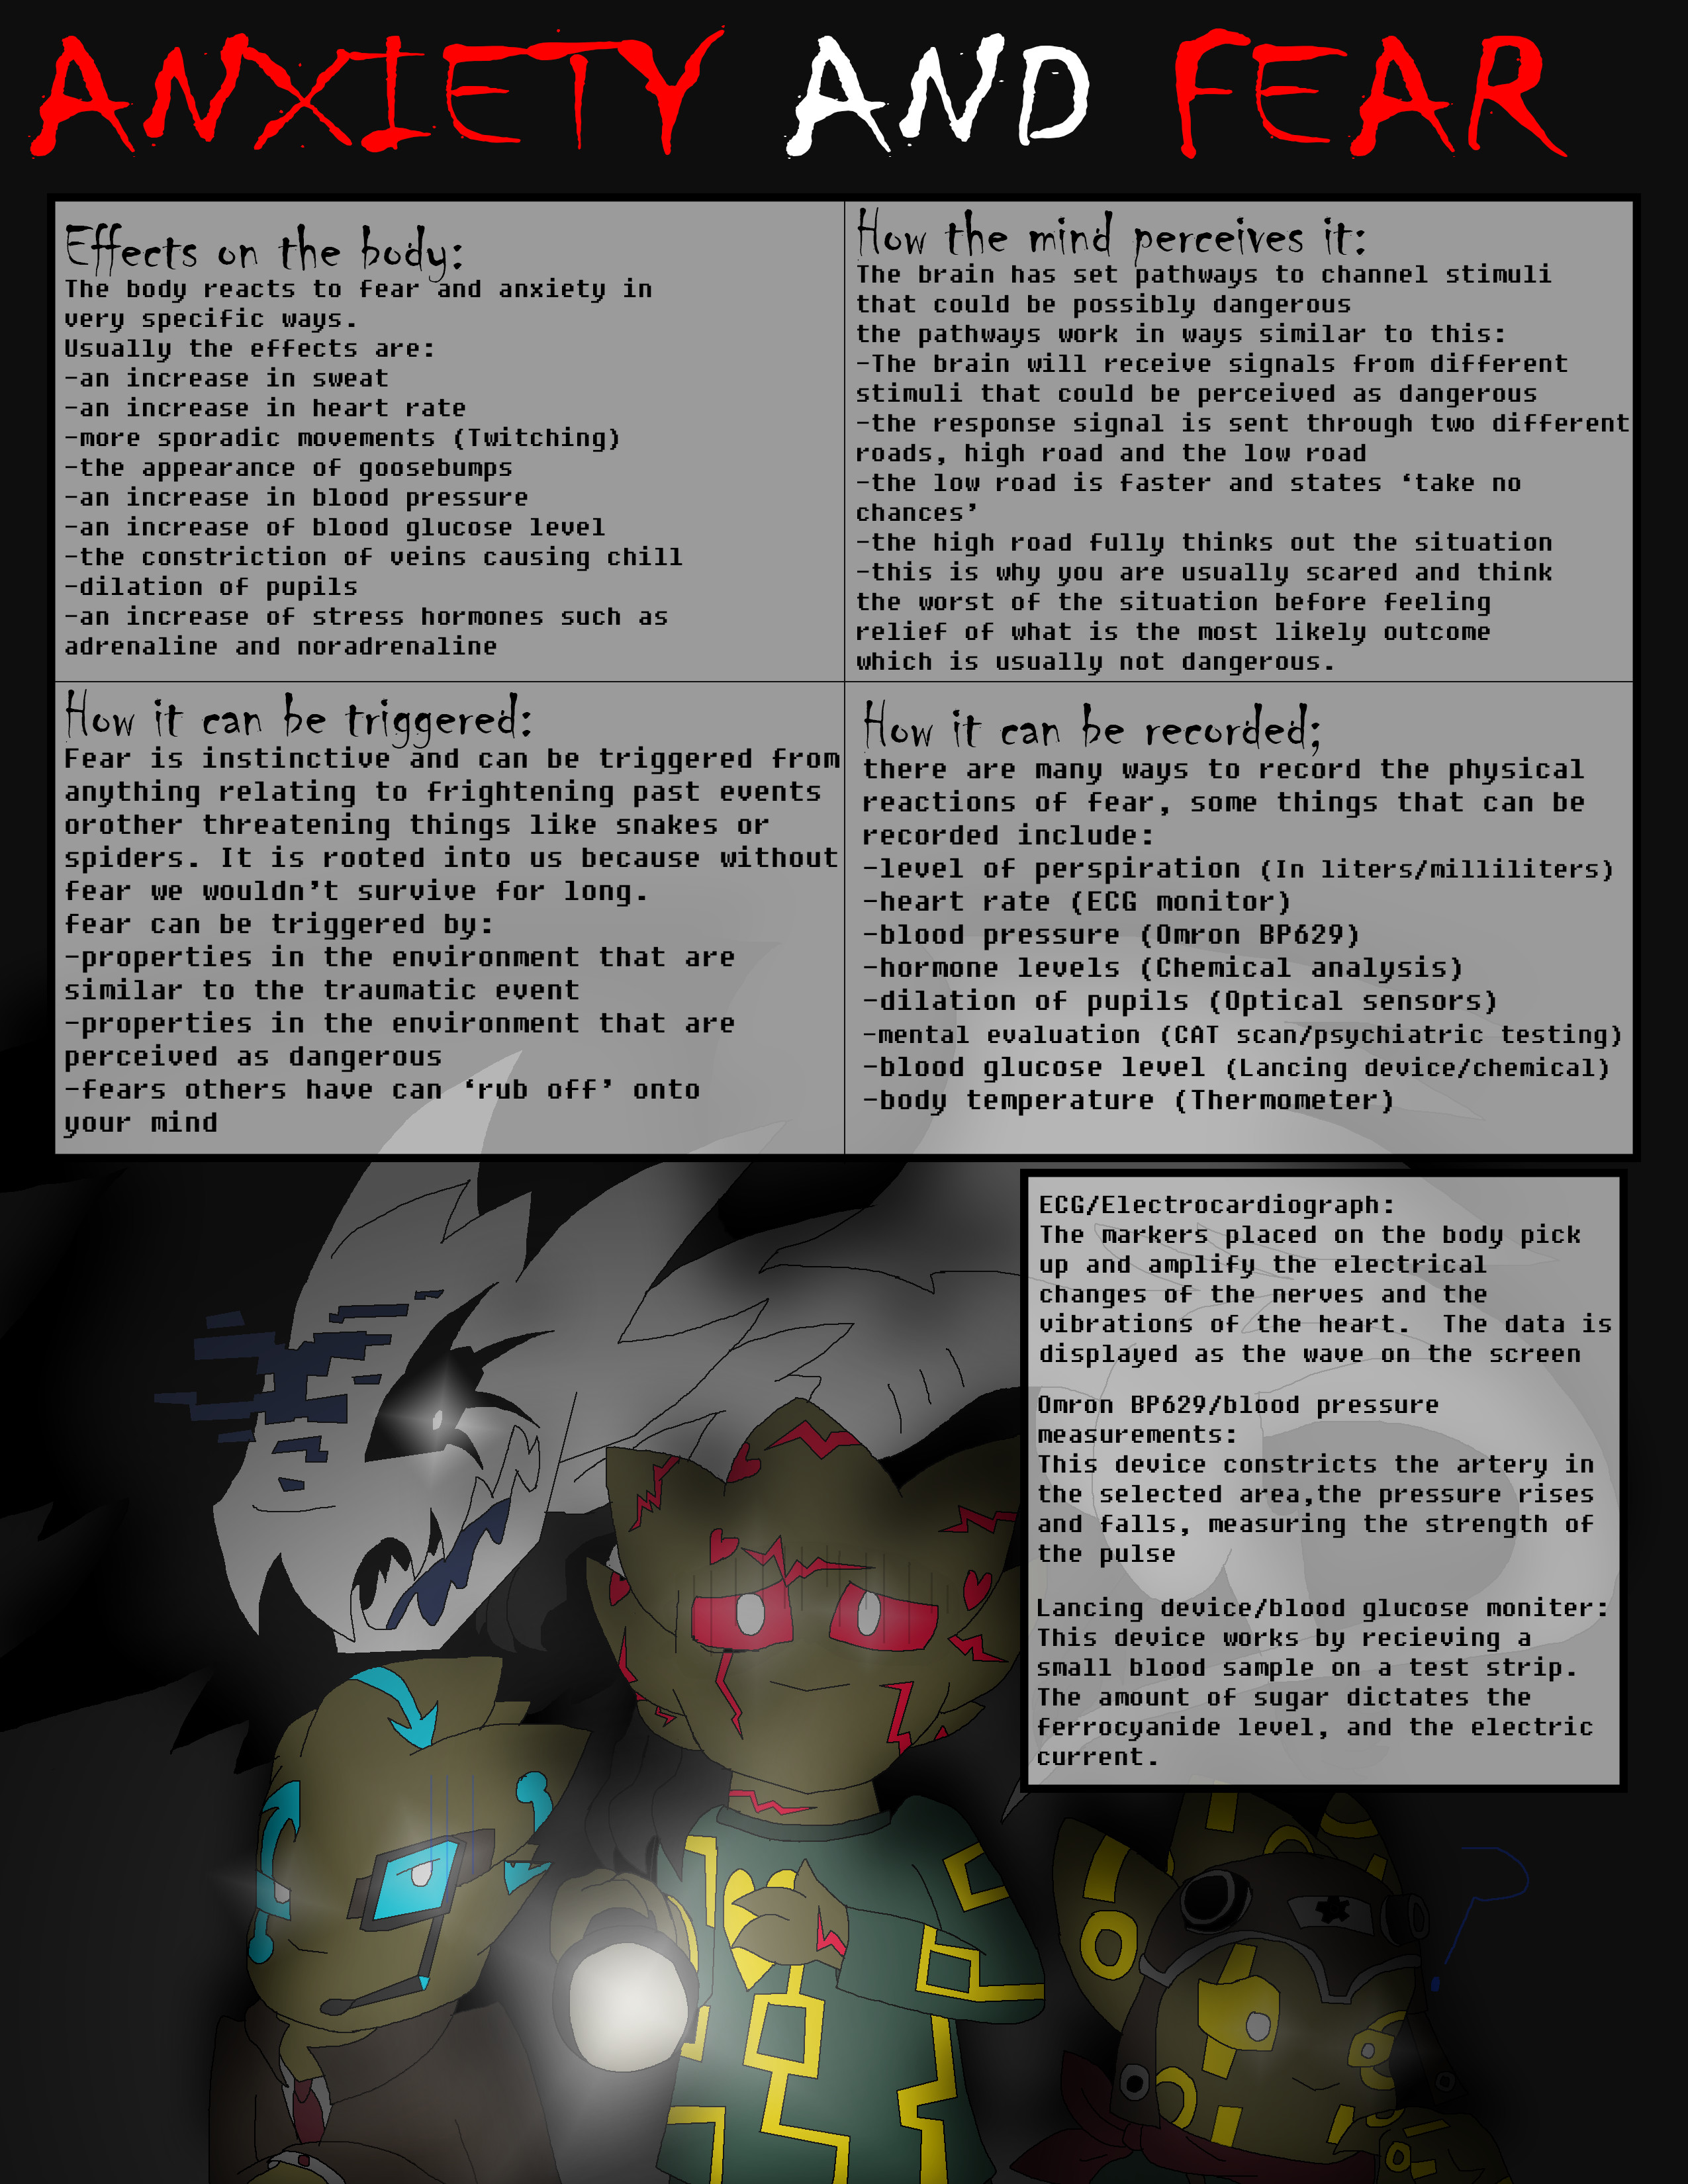
0 Comments
Hi Mr.B! This is my extremely rushed blog post because i forgot to do it over the weekend in my buizied rush! So i have barely skimmed over the document and ive decided to talk about the visualization stuff i have learned in previous years. I have been taught the various types of graphs from my advanced science and math classes, and from science fairs and experiments. I understand the importance of visualization from these various experiments. Like the fact that the line graphs are used for time measurement and other related topics etc. The importance of them is to help people who haven't read the experiment or yourself by putting them in a visual aspect. Like how drawing a character can sometimes show their personality. I have about two minutes left so let's see what else i can do in my frenzied panic. visualization can help people in many different careers and i have to stop typing now or risk being late to Spanish! Sorry for the inconvenience!
|
Creator InfoThis is a blog for a Game Art Design class. Future programmer and currently an artist and writer. 
Archives
June 2019

Categories
All
|
 RSS Feed
